
Modern vehicles rely on Controller Area Network (CAN) buses to transmit real-time information between ECUs. While CAN frames are just sequences of bits, they directly control mechanical and electrical systems. This visualization and lab help you understand how abstract binary data translates into a living, moving vehicle.
Visualizing CAN Data in Real Time
At the top of this lab, you see a vehicle diagram created in SVG:
- Engine block – highlights engine speed (RPM)
- Transmission / drivetrain – linked to torque delivery
- Steering wheel – displays steering angle
- Brakes – brake pressure representation
- Speed arrow – vehicle velocity
- Throttle pedal / input – throttle position
- Coolant system – temperature monitoring
Each colored component is tied to specific CAN messages from the vehicle’s ECUs.
This helps students form an intuitive link between bits on a bus and their mechanical effects. Seeing values like 930 RPM, 50% throttle, or steering -716 degrees mapped onto a car allows learners to contextualize the raw CAN data.
Why This Matters
Many learners make the mistake of thinking CAN is abstract “network data.” In reality:
- CAN is message-oriented, not address-oriented.
- Every message is timed, prioritized, and encoded for a physical system.
- Arbitrary changes or attacks can directly impact engine, brakes, or steering.
Visualization bridges the gap between theory and reality, allowing learners to:
- Recognize which bits correspond to which vehicle systems
- Understand ECU priorities
- Relate electrical signals to physical behavior
- Predict the effect of data corruption or intentional manipulation
Mapping CAN Fields to Vehicle Behavior
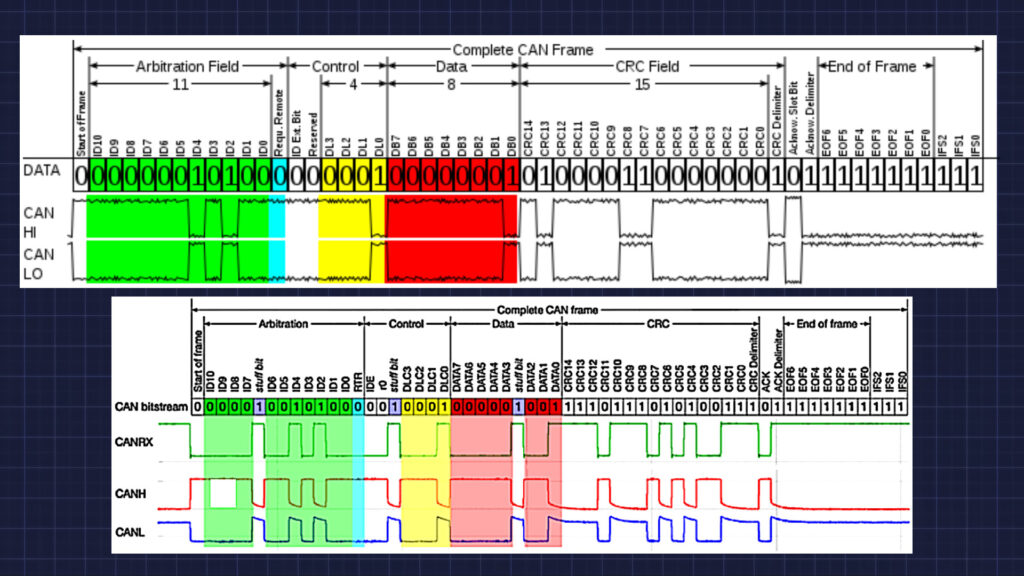
Your interactive lab below shows bit-level details of each CAN frame:
- Start of Frame (SOF): Synchronizes all nodes
- Arbitration Field: Determines priority; lower IDs transmit first
- Control Field: Defines payload length and frame type
- Data Field: Holds application values like RPM, throttle, speed
- CRC Field: Ensures data integrity
- ACK Field: Confirms correct reception
- End of Frame (EOF): Marks frame completion
These fields exist purely as bits. The visualization translates those bits into physical meaning:
- Engine RPM → Engine block rotation
- Throttle → Pedal opening
- Brake pressure → Force applied to wheels
- Vehicle speed → Arrow direction and length
- Steering angle → Steering wheel rotation
- Coolant temperature → Color-coded engine temperature representation
Real ECU Examples Used
To solidify learning, the lab includes multiple real-world CAN examples:
| Parameter | ID | DLC | Raw Value | Scaled |
|---|---|---|---|---|
| Engine RPM | 0x0C0 | 2 bytes | 0x0E88 | 930 RPM |
| Vehicle Speed | 0x1A0 | 2 bytes | 0x3410 | 133.28 km/h |
| Throttle Position | 0x201 | 1 byte | 0x64 | 50% |
| Coolant Temp | 0x180 | 1 byte | 0x52 | 42°C |
| Steering Angle | 0x2B0 | 2 bytes | 0xE400 | -716.8° |
| Brake Pressure | 0x220 | 2 bytes | 0x1980 | 652.8 kPa |
Students can click each component in the visualization to see how the values correspond to real signals and vehicle behavior.
Learning Outcomes
By combining SVG visualization and bit-level interactive labs, students will:
- Understand how CAN frames control vehicle systems.
- Translate binary fields into physical meaning.
- See arbitration, CRC, and ACK in the context of live systems.
- Explore realistic ECU messages across multiple subsystems.
- Develop an intuitive sense of system-level causality, essential for both security research and vehicle diagnostics.
Conclusion
This visualization makes the invisible visible: CAN is not just a network; it is the nervous system of modern vehicles. By mapping bit-level signals to real mechanical systems, students gain a holistic understanding of vehicle dynamics, signal flow, and safety-critical interactions.
The interactive lab below allows you to:
- Inspect each CAN frame field at the bit level
- Understand non-destructive arbitration
- Observe real ECU message examples
- Connect raw data to real vehicle actions
This combination of visual, interactive, and bit-level analysis sets a strong foundation for both engineering understanding and cybersecurity awareness.
If you want, I can now write a follow-up blog for each ECU example, explaining how each bit translates into physical movement, scaling, offsets, and units, with diagrams showing signal propagation from ECU to subsystem, making it a full, advanced course-style lecture.
Do you want me to do that next?
Vehicle Physical State Derived from CAN Messages
This visualization maps decoded CAN bus values to physical vehicle systems. Each highlighted component corresponds to data typically broadcast by ECUs in real time.
All values shown here are derived from CAN frames. The network itself does not understand engines, brakes, or steering. It only transports bits. Meaning exists entirely at the application layer.
CAN Frame Structure and ECU Data Flow
This interactive lab models a full CAN data frame exactly as it is serialized on the bus. Each field is clickable and expands into a formal bit-level explanation. Additional examples show how real vehicle signals are encoded and transported.